

Yellowfin BI
by Yellowfin International Pty Ltd
What is Yellowfin BI?
Get Best Quote for Yellowfin BI
Connect with SaaSrat experts to get the best quote for your business.
You're all set!
A specialist for Yellowfin BI will reach out within 1 business day.
Yellowfin BI Features
Embedded analytics with white-label branding
Automated signals and threshold alerts
Self-service dashboards with drag-and-drop
Yellowfin Stories for data narratives
Yellowfin Present for executive briefings
Pre-built and custom data connectors
View All 17 Features
Yellowfin BI Pricing Plans
Aligned Utility
- Price per analytics unit aligned to your sales model (site, app, device, bus). For ISVs whose product sells by unit.
Revenue Share
- Pricing based on a share of analytics-driven revenue from add-on modules. For SaaS vendors charging for analytics.
Server Core
- Fixed price per server core (e.g., 4-core deployment), scales with deployment size only. For internal enterprise BI with predictable load.
Internal BI Subscription
- Quote-based per user or per server for direct enterprise analytics use. Buyers select user band: under 25, 25-100, 100-500, 500+.
Yellowfin BI Screenshots
Description
What is Yellowfin BI?
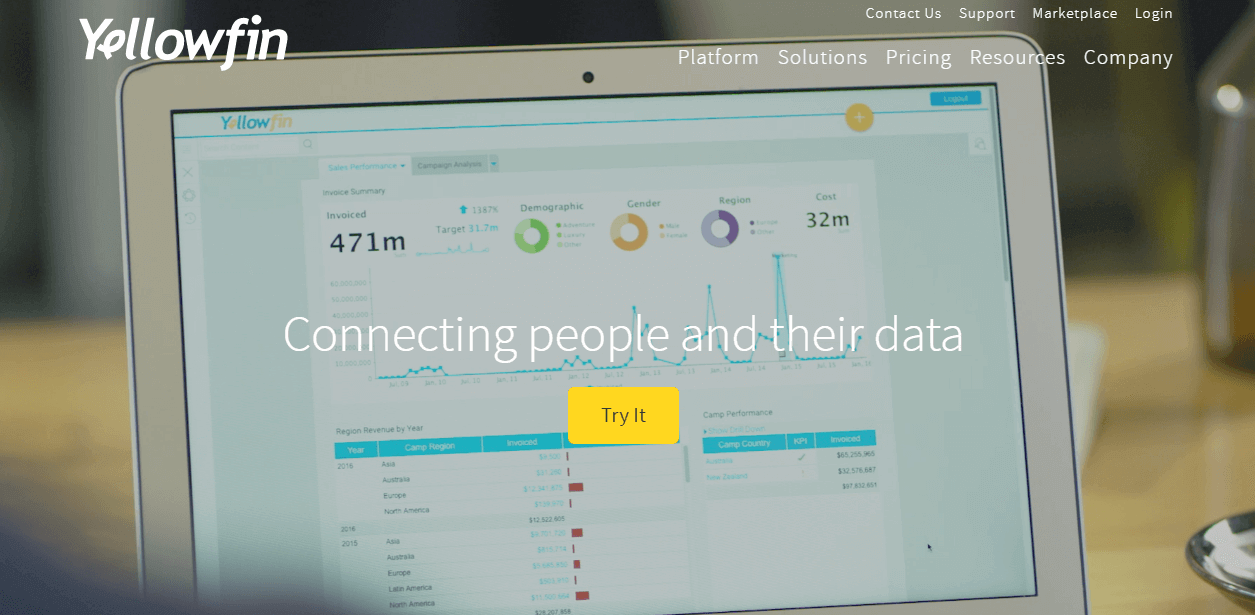
Yellowfin BI is an end-to-end business intelligence and embedded analytics suite developed in Melbourne, Australia since 2003. It combines self-service dashboards, automated signals, and a data storytelling layer called Yellowfin Stories that turns insights into shareable narratives.
The company sells two product motions side by side. The first is enterprise BI for internal analysts and business users. The second is embedded analytics that ISVs and SaaS vendors place inside their own products under a white-label brand. The embedded motion is where Yellowfin has won the most differentiation against Tableau and Power BI.
Who Yellowfin BI is built for
Yellowfin fits three buyer profiles. First, ISVs and SaaS companies that need to embed analytics inside their applications without rebuilding charting from scratch. Second, mid-market enterprises (500 to 5,000 employees) that want a BI platform with stronger data storytelling than Tableau out of the box. Third, public sector and regulated industries that value EU and Australian data hosting options.
It is less of a fit for small businesses on a tight budget (Power BI and Looker Studio undercut on price at the entry point) and for organizations already deep into the Microsoft Fabric or Snowflake-native stack where Power BI or Sigma have closer integration.
Yellowfin BI pricing plans
| Pricing model | How it works | Best for |
|---|---|---|
| Aligned Utility | Price per analytics unit aligned to your sales model (site, app, device, bus) | ISVs whose product sells by unit |
| Revenue Share | Pricing based on a share of analytics-driven revenue | SaaS vendors charging extra for analytics modules |
| Server Core | Fixed price per server core (e.g., 4-core deployment), scales with deployment size | Internal enterprise BI with predictable user load |
| Internal BI | Quote-based per user or per server | Direct enterprise analytics use |
Yellowfin does not publish dollar amounts. Buyers request a quote based on user band: under 25, 25 to 100, 100 to 500, or 500-plus. Typical mid-market server-core deployments land in the $30,000 to $80,000 per year range. Embedded OEM contracts vary widely based on the revenue or unit-share model.
The three-model pricing structure is one of Yellowfin's deliberate differentiators. Tableau and Power BI both lock buyers into per-user seats, which gets expensive at scale. Yellowfin's Revenue Share and Aligned Utility models let ISVs match analytics cost to their own pricing motion, which keeps margins predictable.
Yellowfin BI core capabilities
Dashboards combine multiple charts, filters, and text into a single canvas. Drag-and-drop construction works for business users; the Code Mode editor lets SQL writers drop into raw query construction when needed. Yellowfin supports more than 30 chart types including geospatial, network, and time-series-specific visualizations.
Self-service preparation lets analysts transform data inside Yellowfin: joins, calculated fields, filters, and pivots without going back to the data warehouse team. The transformation layer is lighter than a dedicated tool like dbt or Alteryx but covers most analyst workflows.
Connectors cover Snowflake, Redshift, BigQuery, Synapse, PostgreSQL, MySQL, Oracle, SQL Server, Salesforce, NetSuite, Google Analytics, and 100-plus other sources. JDBC and ODBC connections handle the long tail.
Yellowfin Signals and automated insights
Signals is Yellowfin's automated alerting engine. It watches metrics for statistical anomalies and notifies the right user when a signal trips. Unlike static threshold alerts, Signals uses time-series statistical methods to flag what is actually unusual versus normal variation.
For mid-market customers this is one of the strongest reasons to pick Yellowfin over Tableau. It moves analytics from passive dashboard viewing into active alerting without requiring a data science team to build custom alerts.
Yellowfin Stories and Present
Stories is a narrative layer that combines charts, commentary, and inline filtering into a long-form data story. Analysts write stories the way journalists do: an introduction, charts, paragraphs of analysis, and a conclusion. Stories embed live data so they stay current.
Present turns the same content into presentation slides for executive briefings. The chart embeds stay live so a slide shown in next month's board meeting reflects this month's numbers without manual updating.
Embedded analytics
Embedded is Yellowfin's growth motion. ISVs place Yellowfin inside their own product with white-label branding: customer logo, color palette, custom fonts, hidden Yellowfin chrome. Single sign-on flows from the host application through to embedded dashboards using SAML, OAuth, or token-based auth.
Multi-tenant architecture isolates customer data inside a shared deployment. Row-level security ties to user attributes from the host application, so embedded dashboards show only the data that user is allowed to see. This is the technical depth that distinguishes Yellowfin from embedding a static Tableau view inside an iframe.
Mobile and offline
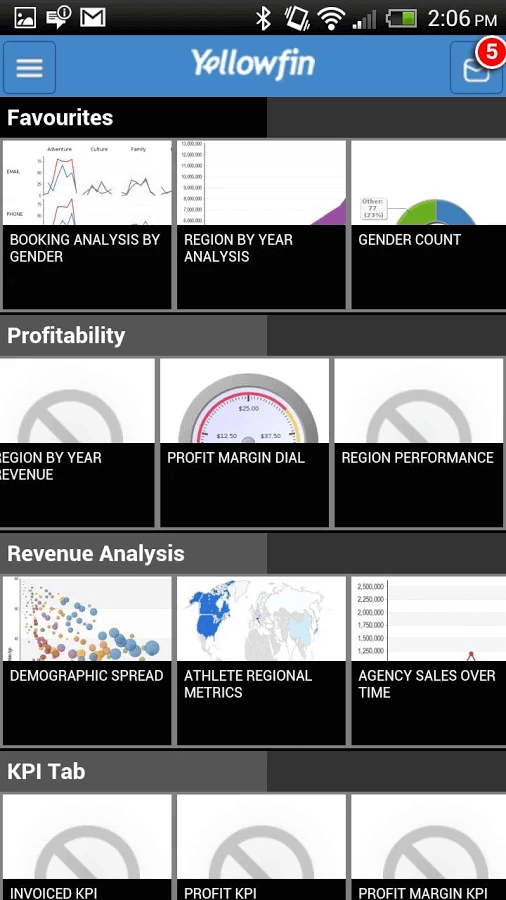
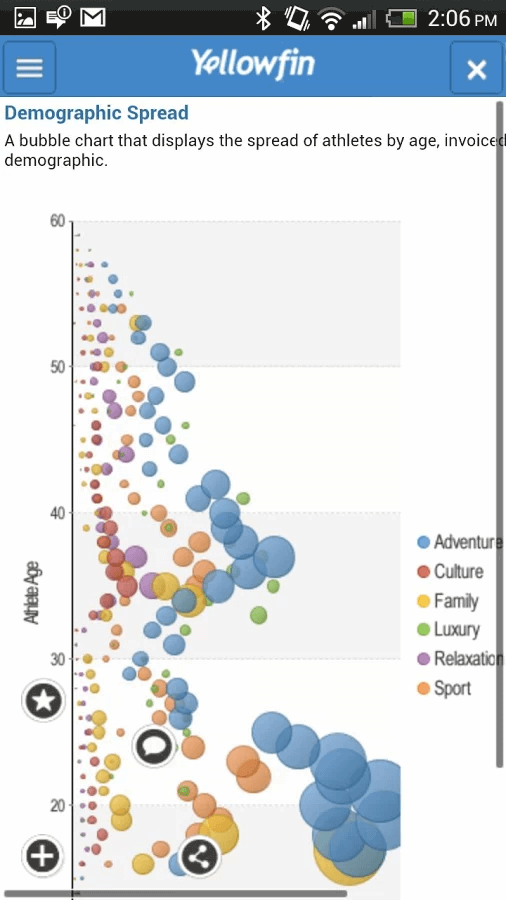
iOS and Android apps render the full dashboard catalog and Signals notifications. Offline caching keeps key dashboards available without a connection, useful for field engineers and sales reps. Mobile-first dashboards can be designed separately from desktop layouts so charts adapt to small screens without losing readability.
Security and compliance
Yellowfin holds SOC 2 Type II and ISO 27001 certifications. Customers can self-host on their own infrastructure (Windows, Linux, Docker, Kubernetes), use Yellowfin's managed cloud, or pick a regional managed service in the US, EU, UK, or Australia. The self-host option matters for public sector and healthcare buyers that need data to stay inside specific geographies.
Identity integration covers SAML, OAuth 2.0, Active Directory, LDAP, and SCIM provisioning. Row-level and column-level security policies enforce data access at the query layer, not the UI layer, which is the right place for them.
Yellowfin BI vs Tableau
Tableau is the most-used enterprise BI platform with the largest community and the broadest training ecosystem. Yellowfin is the more focused embedded analytics platform with stronger automated alerting through Signals. Tableau wins on chart customization depth and the size of the user community. Yellowfin wins on embedded ISV pricing models and Signals-driven proactive analytics.
Yellowfin BI vs Power BI
Power BI is the cheapest serious BI tool, deeply integrated into Microsoft 365 and Azure. Yellowfin is more expensive but vendor-neutral and stronger on embedded analytics. Pick Power BI if you are a Microsoft shop with no embedded analytics need. Pick Yellowfin if you are embedding analytics inside a SaaS product or running multi-cloud.
Yellowfin BI vs Sisense
Sisense is the closest direct competitor for embedded analytics. Both target ISVs and offer flexible OEM pricing. Sisense has stronger AI-driven natural language query (Sisense Fusion). Yellowfin has cleaner Stories and Present functionality. Both are credible picks for embedded; pick on the specific feature gap that matters most.
Yellowfin BI vs Looker
Looker (now Looker Studio Pro under Google) is the LookML-modeled BI tool that built a strong analyst following. Yellowfin is the chart-first BI tool with a more approachable learning curve. Looker wins for teams that want a single semantic model layer across all analytics. Yellowfin wins for teams that want faster time-to-dashboard without first learning LookML.
Buyer pitfalls to avoid
Three patterns hurt Yellowfin rollouts. First, picking a pricing model without modeling out three-year cost: Aligned Utility looks great at year one then escalates if your unit count grows. Second, treating embedded analytics as a project not a product: ISVs that embed without a dedicated analytics product manager end up with dashboards that no one trusts. Third, skipping Signals setup: most teams deploy dashboards and never configure Signals, missing the automated alerting that makes Yellowfin worth its price.
Implementation and time to value
Internal BI rollouts take six to twelve weeks for mid-market customers. Embedded OEM rollouts take three to six months including IDP integration, multi-tenant testing, and white-label theming. Yellowfin Solution Partners handle complex deployments; the in-house Customer Success team supports direct customers. Yellowfin Academy publishes role-based training and certifications.
Customer support
Standard contracts include business-hours support with a 4-hour first response SLA. Premium contracts add 24/5 support, a named CSM, and quarterly business reviews. Strategic accounts get 24/7 support and assigned solution architects. The Yellowfin Community forum is moderately active and the documentation is published in English, French, German, Spanish, Portuguese, and Japanese.
The Bottom Line on Yellowfin BI
Yellowfin BI is the right call for ISVs embedding analytics inside SaaS products and for mid-market enterprises that want automated alerting through Signals beyond static dashboards.
Standout strengths: three flexible pricing models (Aligned Utility, Revenue Share, Server Core) that ISVs can match to their own sales motion, automated Signals alerting on time-series anomalies, Stories and Present for data narratives, white-label embedded with multi-tenant row-level security, regional hosting in US EU UK AU.
Pricing is quote-based and lands in mid-market range: typical Server Core deployments are $30K-$80K/year, OEM contracts vary widely with revenue share or unit count. Yellowfin does not publish dollar amounts; buyers submit a form with user band (under 25 to 500-plus) to receive a quote.
Trade-offs to weigh: opaque pricing makes early budget planning harder. Smaller chart customization depth than Tableau. Smaller community and training ecosystem than Tableau or Power BI. Less native Microsoft 365 integration than Power BI.
Alternatives worth comparing: Tableau for internal BI with the largest community, Power BI for Microsoft-shop economics, Sisense for embedded ISV head-to-head, Looker for semantic-model-first BI, Sigma for Snowflake-native cloud BI. Pricing models verified on yellowfinbi.com/pricing on 2026-06-27.
Frequently Asked Questions
Is there a free plan or free trial for Yellowfin BI?
How much does Yellowfin BI cost?
What does Yellowfin BI integrate with?
Who is Yellowfin BI best for?
What are the best alternatives to Yellowfin BI?
Is Yellowfin BI GDPR / SOC 2 compliant?
Does Yellowfin BI have a mobile app?
What do real users say about Yellowfin BI?
How does Yellowfin BI compare to its top competitor?
Does Yellowfin BI offer customer support?
Find Your Perfect Software
See how it can transform your workflow
- Personalized for your needs Tailored recommendations based on your unique requirements.
- Save time & resources Streamline your workflow and boost team productivity.
- Trusted by thousands Join 10,000+ businesses already growing with SaaSrat.
You're all set! 🎉
A specialist for will reach out within 1 business day with tailored recommendations for your needs.