

Slemma
by Slemma
What is Slemma?
Get Best Quote for Slemma
Connect with SaaSrat experts to get the best quote for your business.
You're all set!
A specialist for Slemma will reach out within 1 business day.
Slemma Features
Drag-and-drop dashboard and chart builder
Step-by-step Chart Designer for non-technical users
Pre-built integrations with 50+ data sources
Direct database connections (MySQL PostgreSQL MSSQL Redshift)
Cloud service integrations (Google Analytics Facebook Ads HubSpot Salesforce)
Excel and CSV file uploads
View All 15 Features
Slemma Pricing Plans
Small Business
- Up to 10 users. Includes local files and uploads, cloud service integrations (GA, Facebook Ads, HubSpot, Salesforce), drag-and-drop dashboard builder, step-by-step Chart Designer, mobile-responsive dashboards. For internal SMB analytics.
Standard
- Larger team support with advanced features. Everything in Small Business plus expanded user limits, advanced chart types, scheduled report delivery, custom calculated fields, REST API access, role-based permissions.
Client Reporting
- For agencies serving multiple clients. Everything in Standard plus white-label client portals, per-client isolated dashboards, multi-tenant user management, scheduled email delivery of branded PDF reports to clients, agency-branded URL and look.
Slemma Screenshots
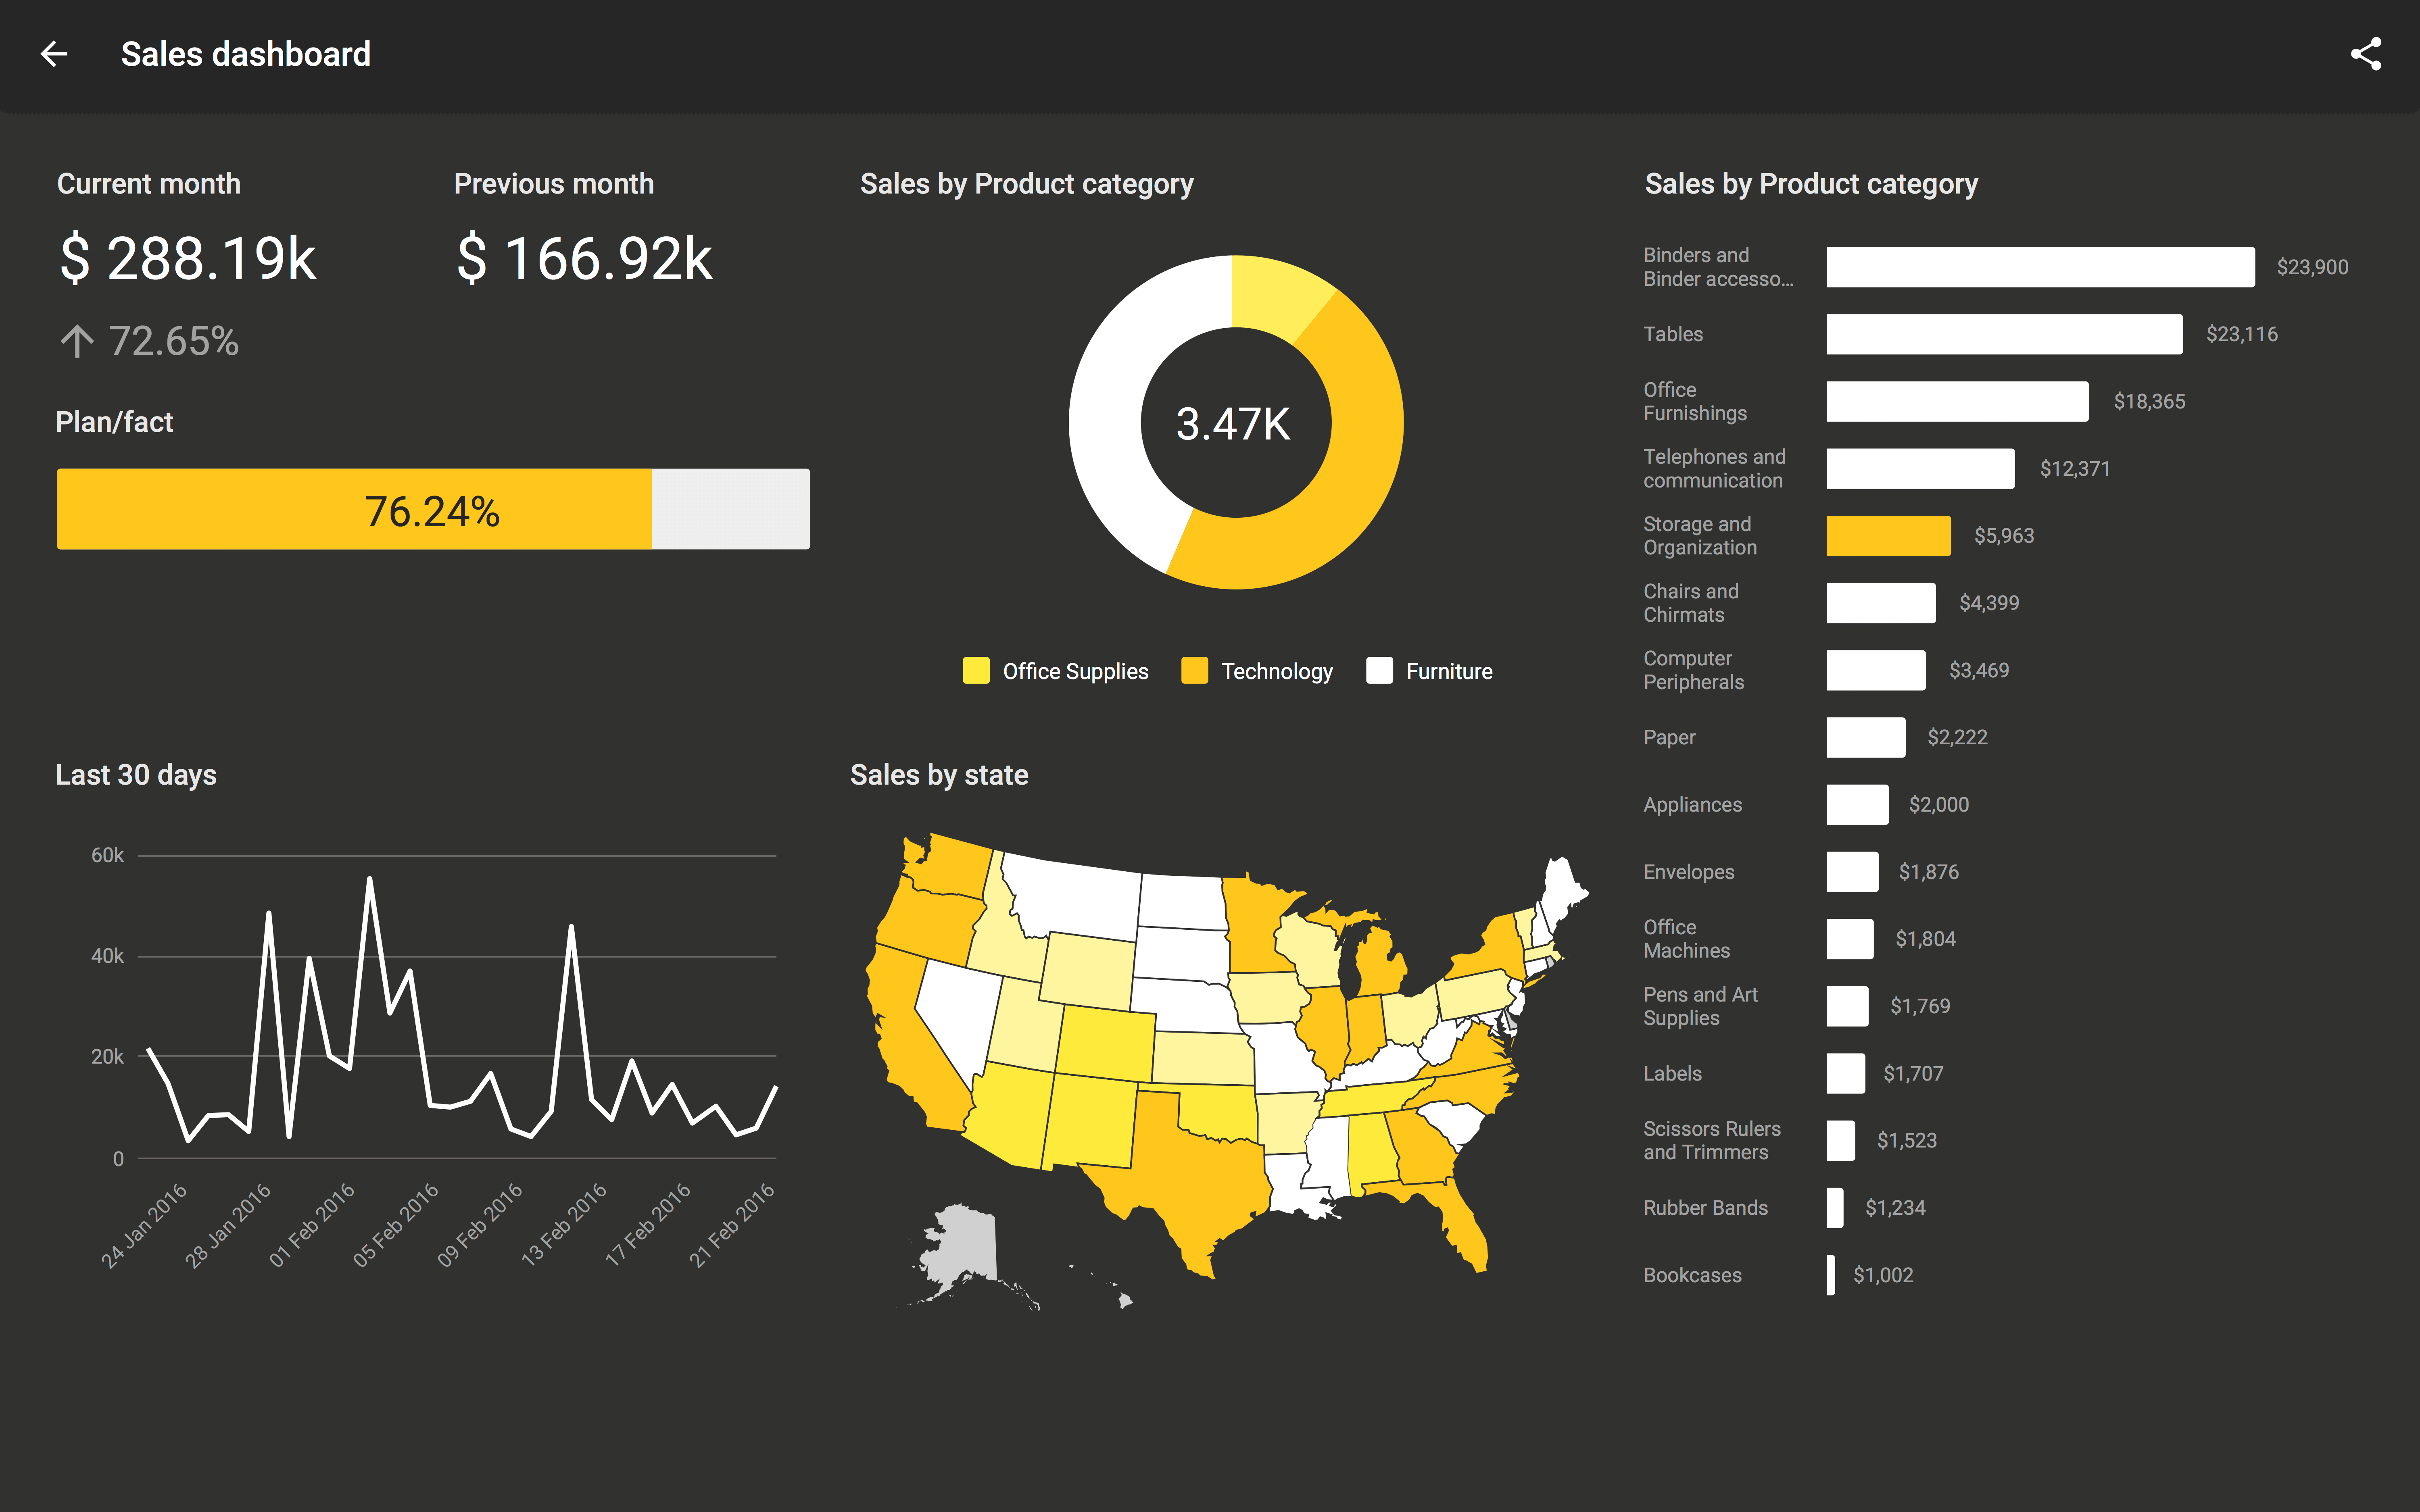
Description
What is Slemma?
Slemma is a cloud-based business intelligence and data visualization platform aimed at small and mid-sized businesses and the agencies that serve them. The product was founded in 2014 and focuses on making data dashboards accessible to non-technical users through a step-by-step Chart Designer rather than requiring SQL or BI development skills.
The strongest positioning is the client reporting use case for marketing agencies. Agencies pull data from Google Analytics, Facebook Ads, Google Ads, HubSpot, Mailchimp, and other tools into a single Slemma dashboard, then embed or share that dashboard with their clients under the agency's brand. This collapses the manual monthly-report PDF workflow most agencies struggle with.
Who Slemma is built for
Slemma fits three buyer profiles. First, marketing agencies and digital consultancies (5 to 50 staff) that report results to multiple clients monthly. The Client Reporting tier exists specifically for this segment. Second, SMB and mid-market businesses (50 to 500 employees) needing data dashboards without buying enterprise BI tools like Tableau or Power BI. Third, SaaS companies that want to embed analytics dashboards in their own product for customers.
The strongest fit is small marketing agencies running monthly client reporting who currently produce reports manually in PowerPoint or Google Slides. Slemma's Client Reporting workflow replaces 5-10 hours per client per month of manual data assembly with automatically-refreshed branded dashboards.
It is less of a fit for enterprise BI needs at scale (Tableau, Power BI, Looker fit better), for data engineering teams needing modeling depth (Looker, Sigma, Hex), or for organizations with established BI tools they are happy with.
Slemma pricing plans
| Plan | Price (monthly) | Best for |
|---|---|---|
| Small Business | $99/mo | 10 users, internal SMB analytics |
| Standard | $199/mo | Larger team with advanced features |
| Client Reporting | $599/mo | Agencies serving multiple clients |
Slemma pricing covers tier-based subscriptions rather than per-user pricing. Small Business at $99/month includes 10 users and is the entry point for internal SMB analytics. Standard at $199/month adds advanced features and larger team support. Client Reporting at $599/month is positioned for marketing agencies and includes white-label client portals, scheduled report delivery to clients, and multi-tenant management.
The Client Reporting tier is the strongest economic argument: an agency reporting to 20 clients monthly saves dozens of hours of manual report assembly. At typical agency hourly rates ($75-$150/hour), the platform pays for itself within the first month.
Slemma core capabilities
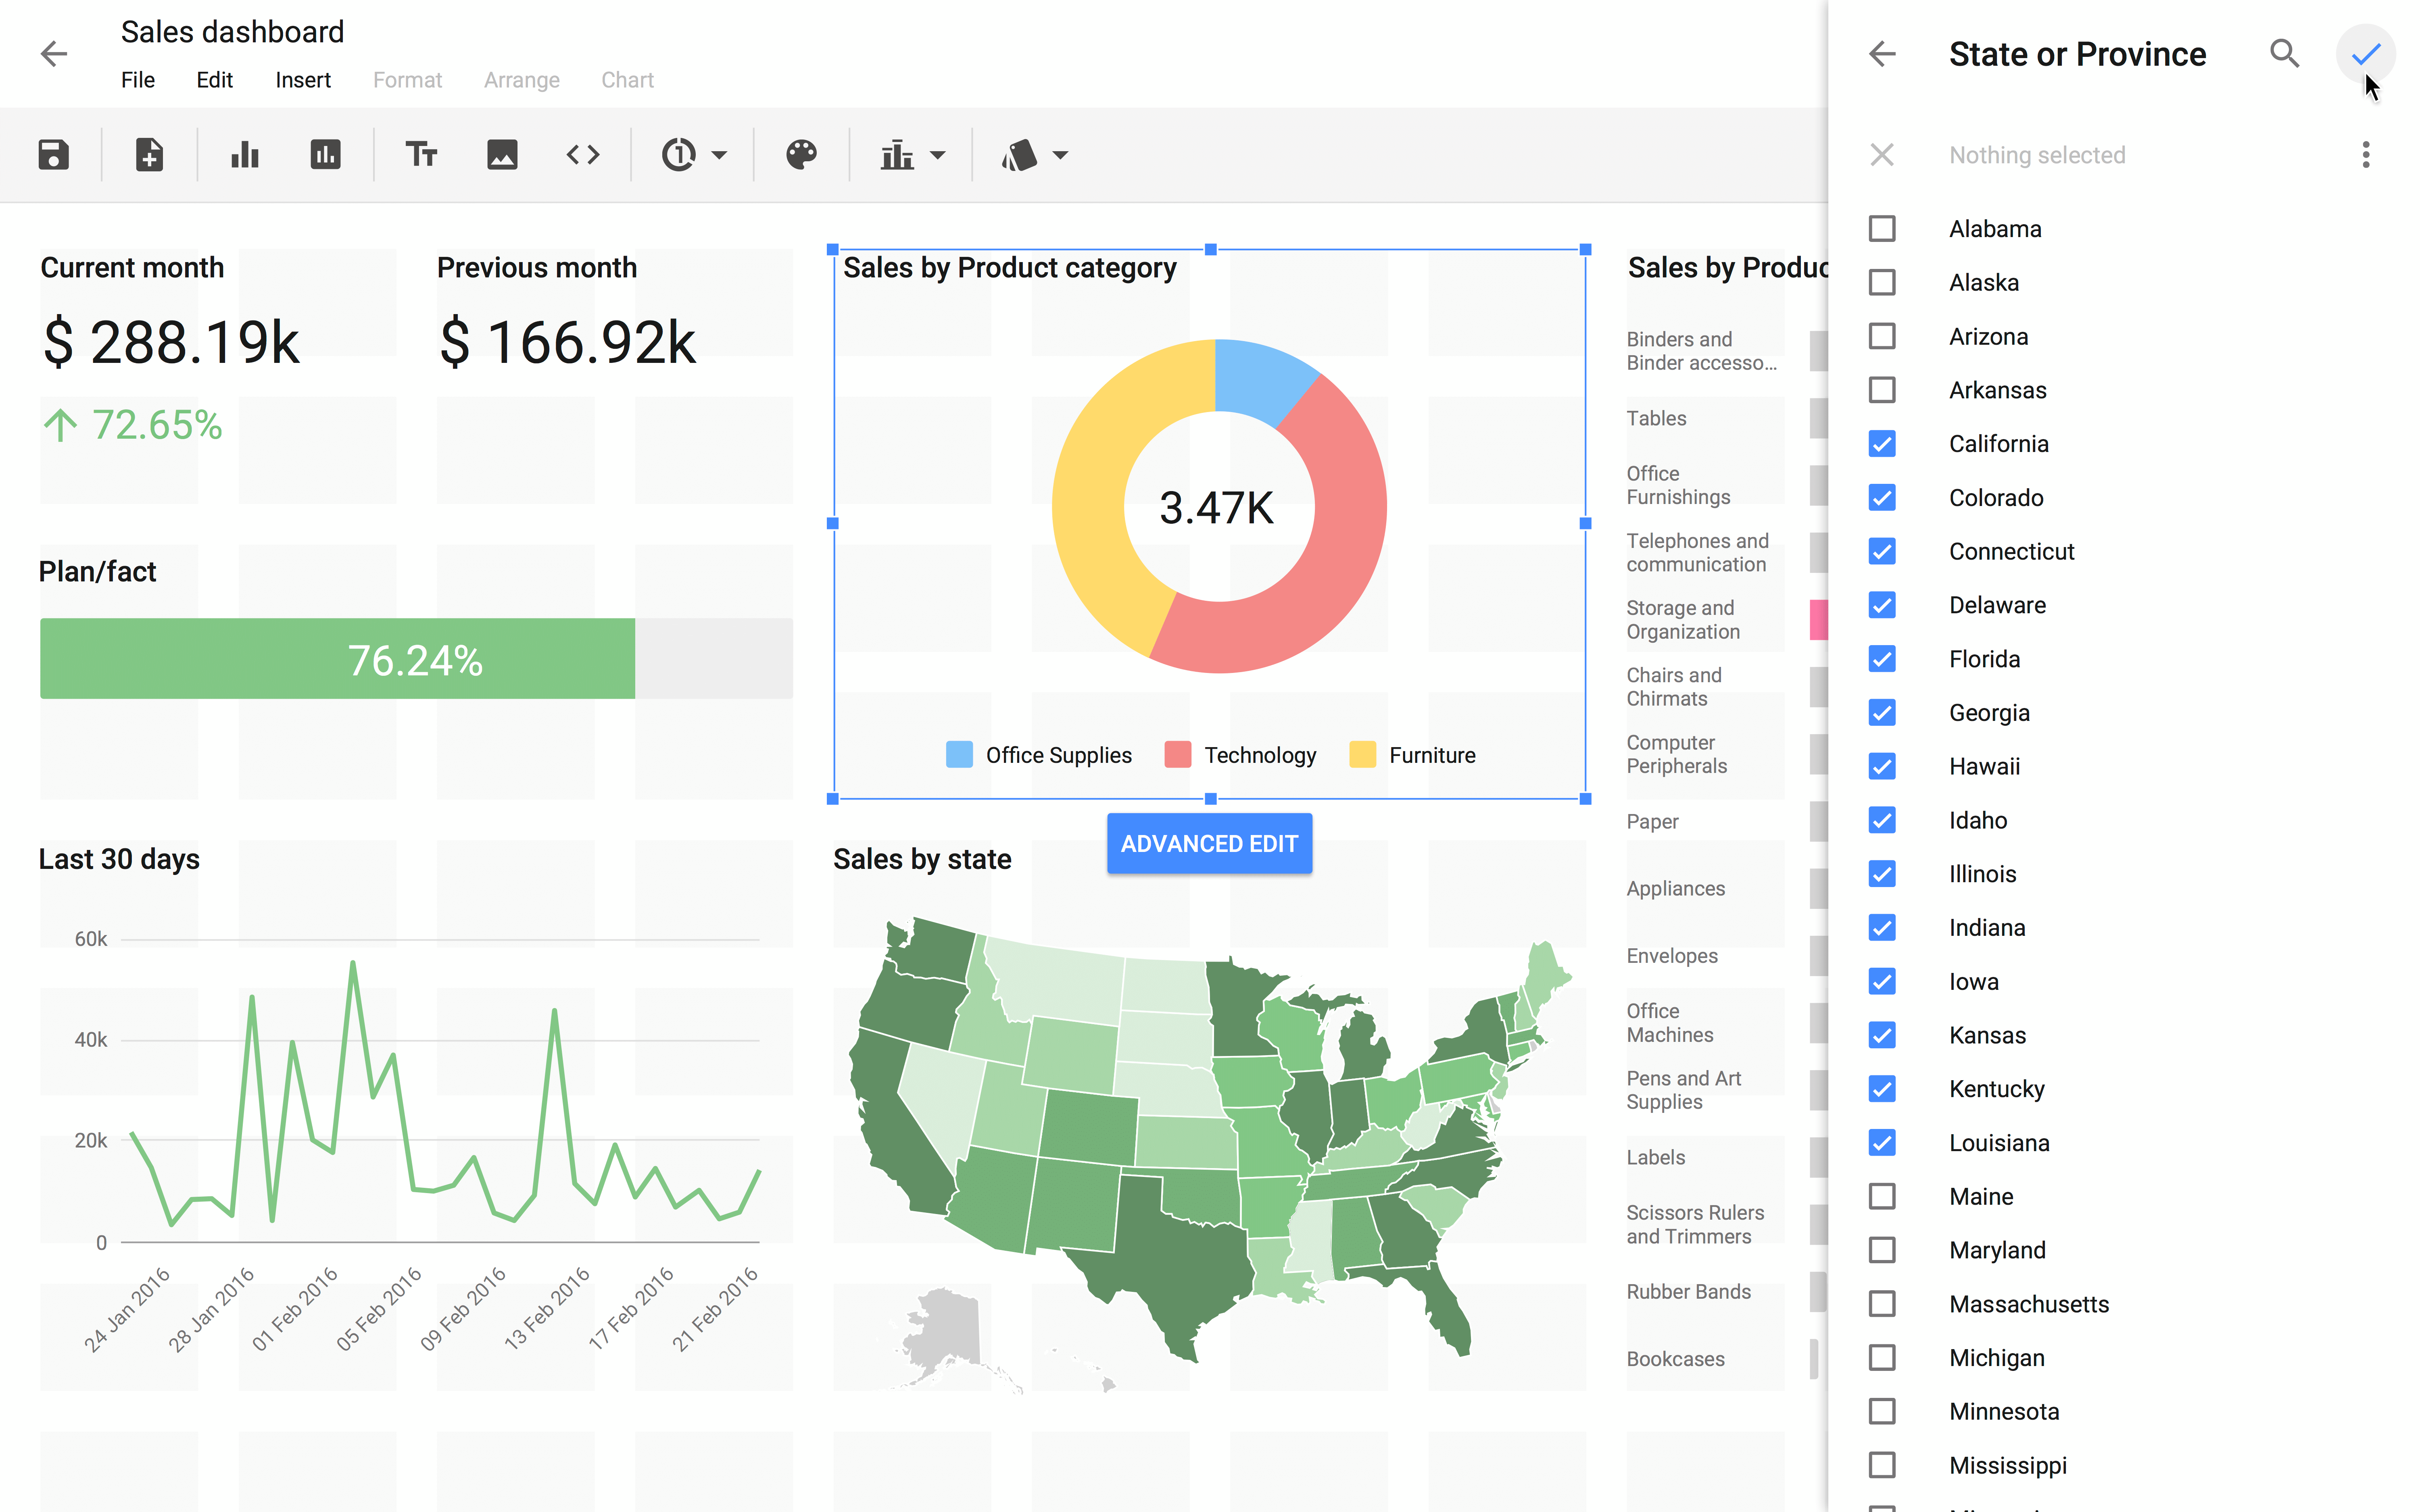
Dashboards are the spine. Each dashboard combines multiple charts, filters, KPI tiles, text blocks, and images into a single canvas. The drag-and-drop builder lets non-technical users assemble dashboards from a chart library.
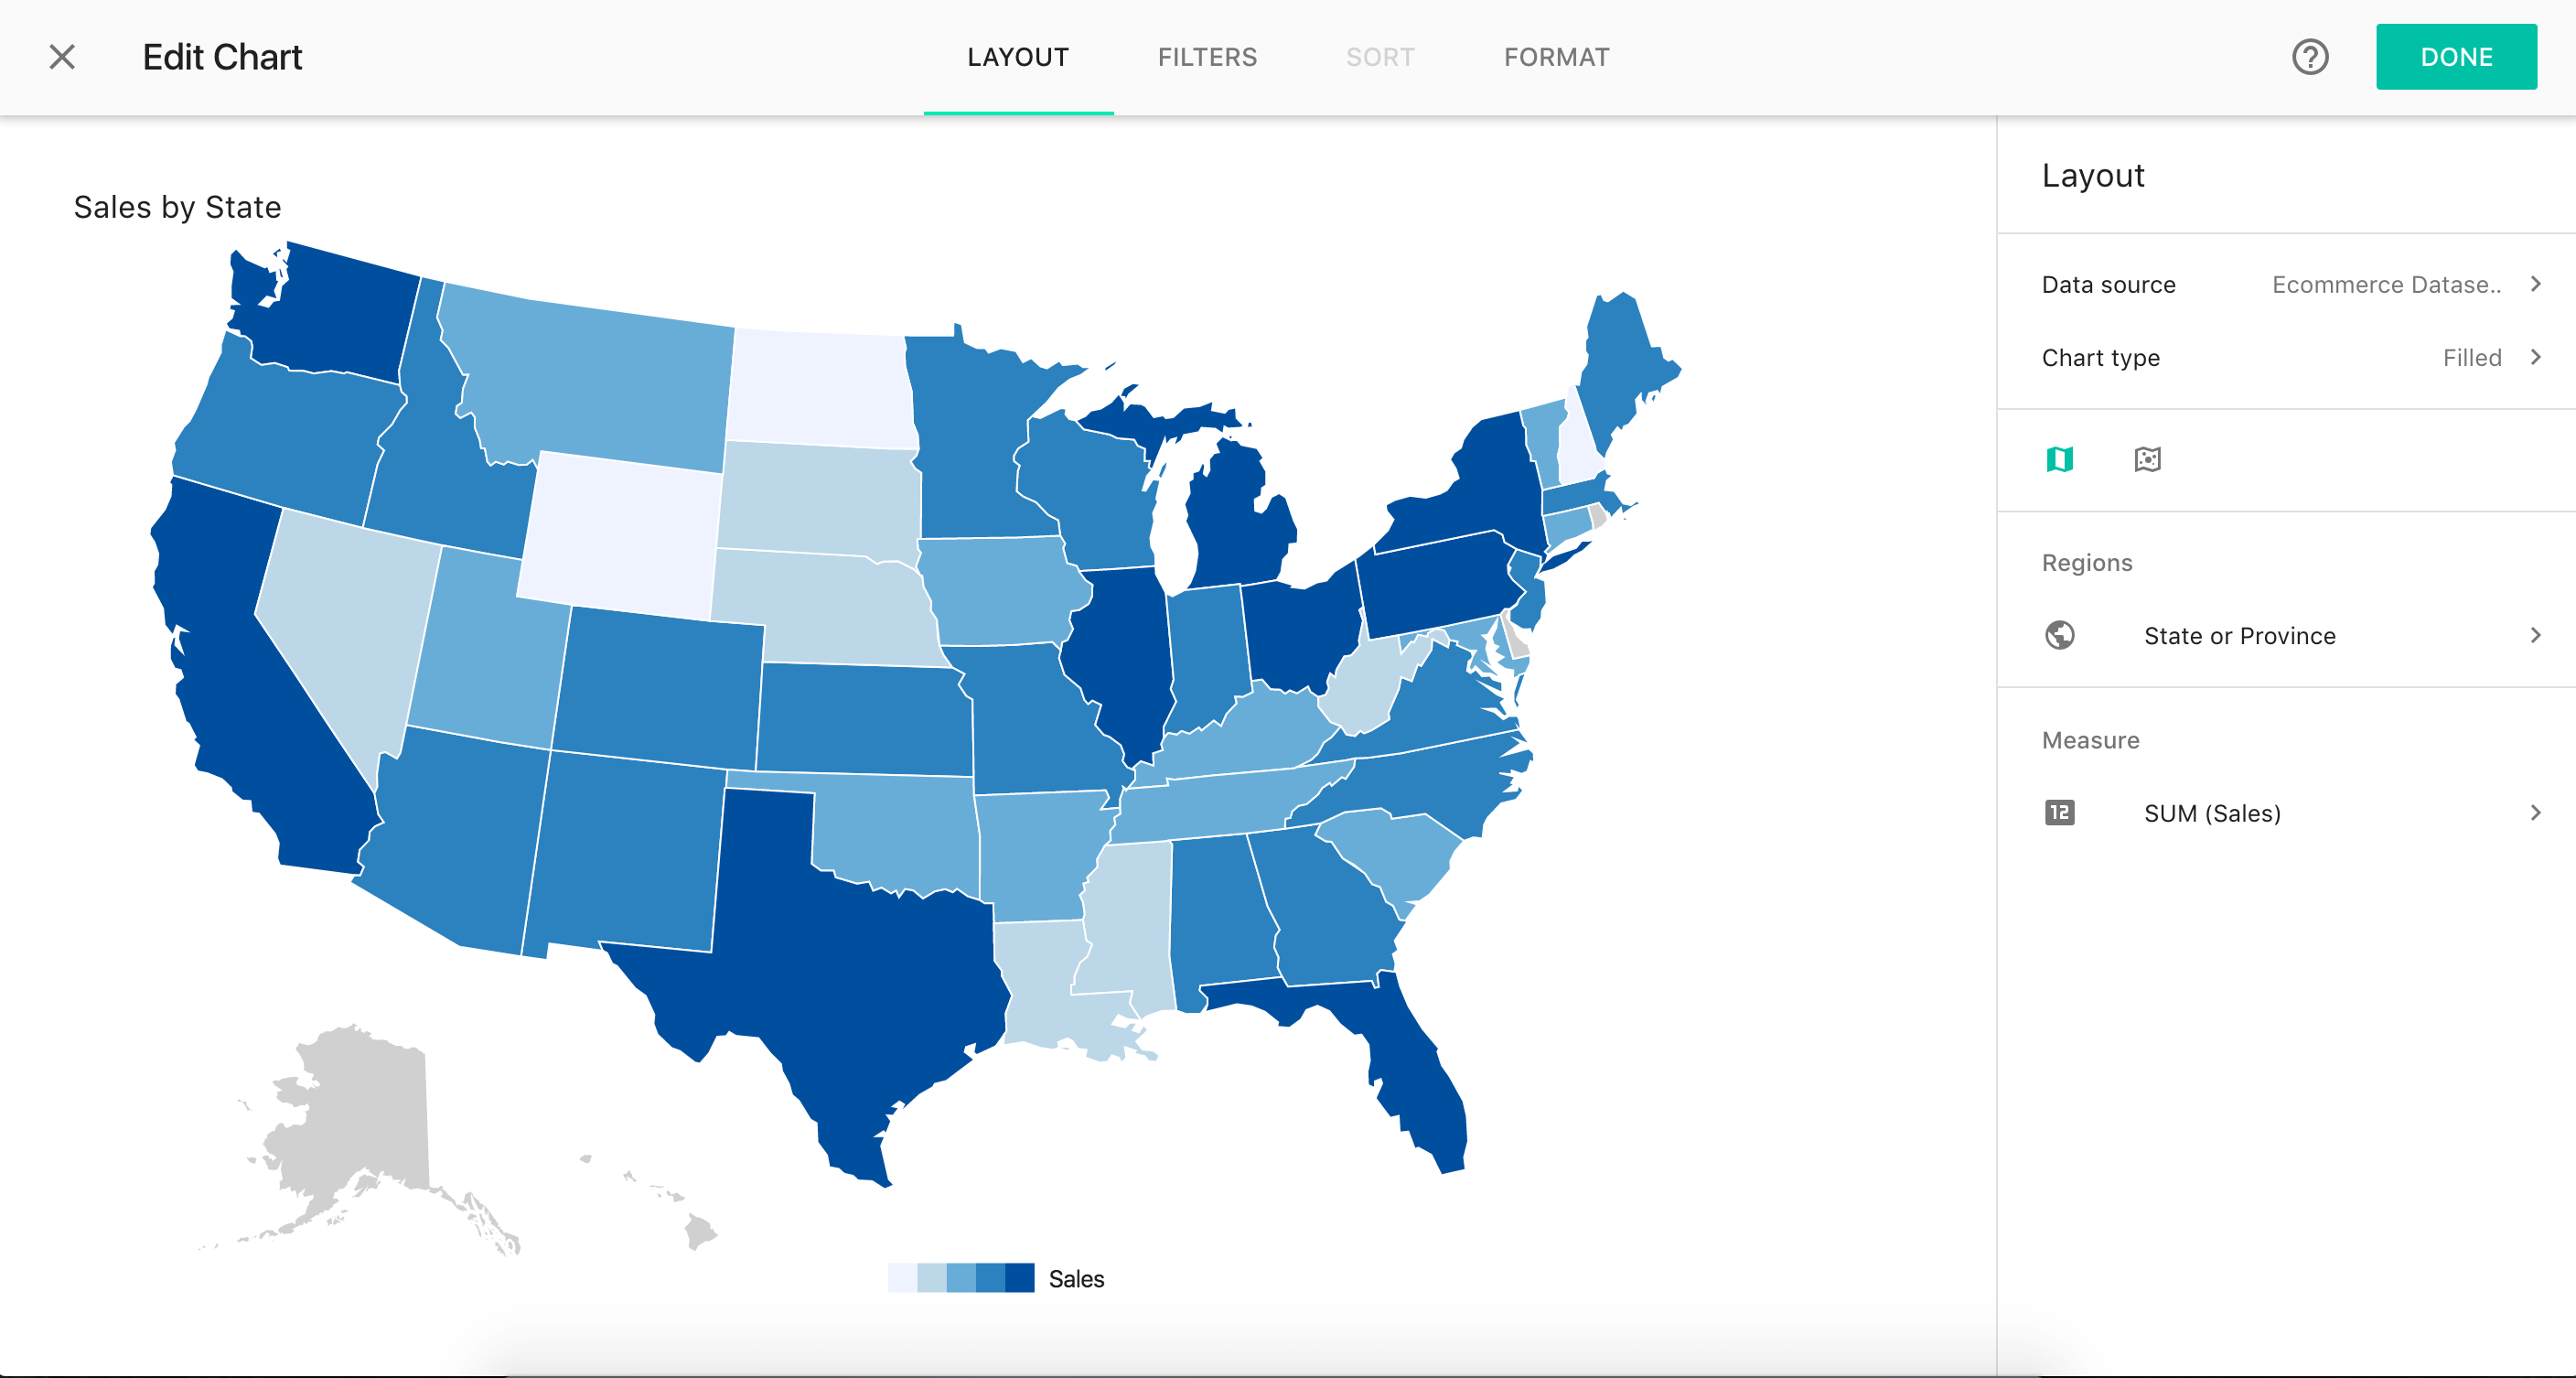
The step-by-step Chart Designer is the differentiator: rather than asking users to write SQL or learn DAX (Power BI's expression language), it walks through a 4-step wizard (select data source, choose chart type, pick fields, format display). This dramatically lowers the technical barrier for SMB users who would otherwise struggle with Tableau or Power BI.
Data sources and integrations
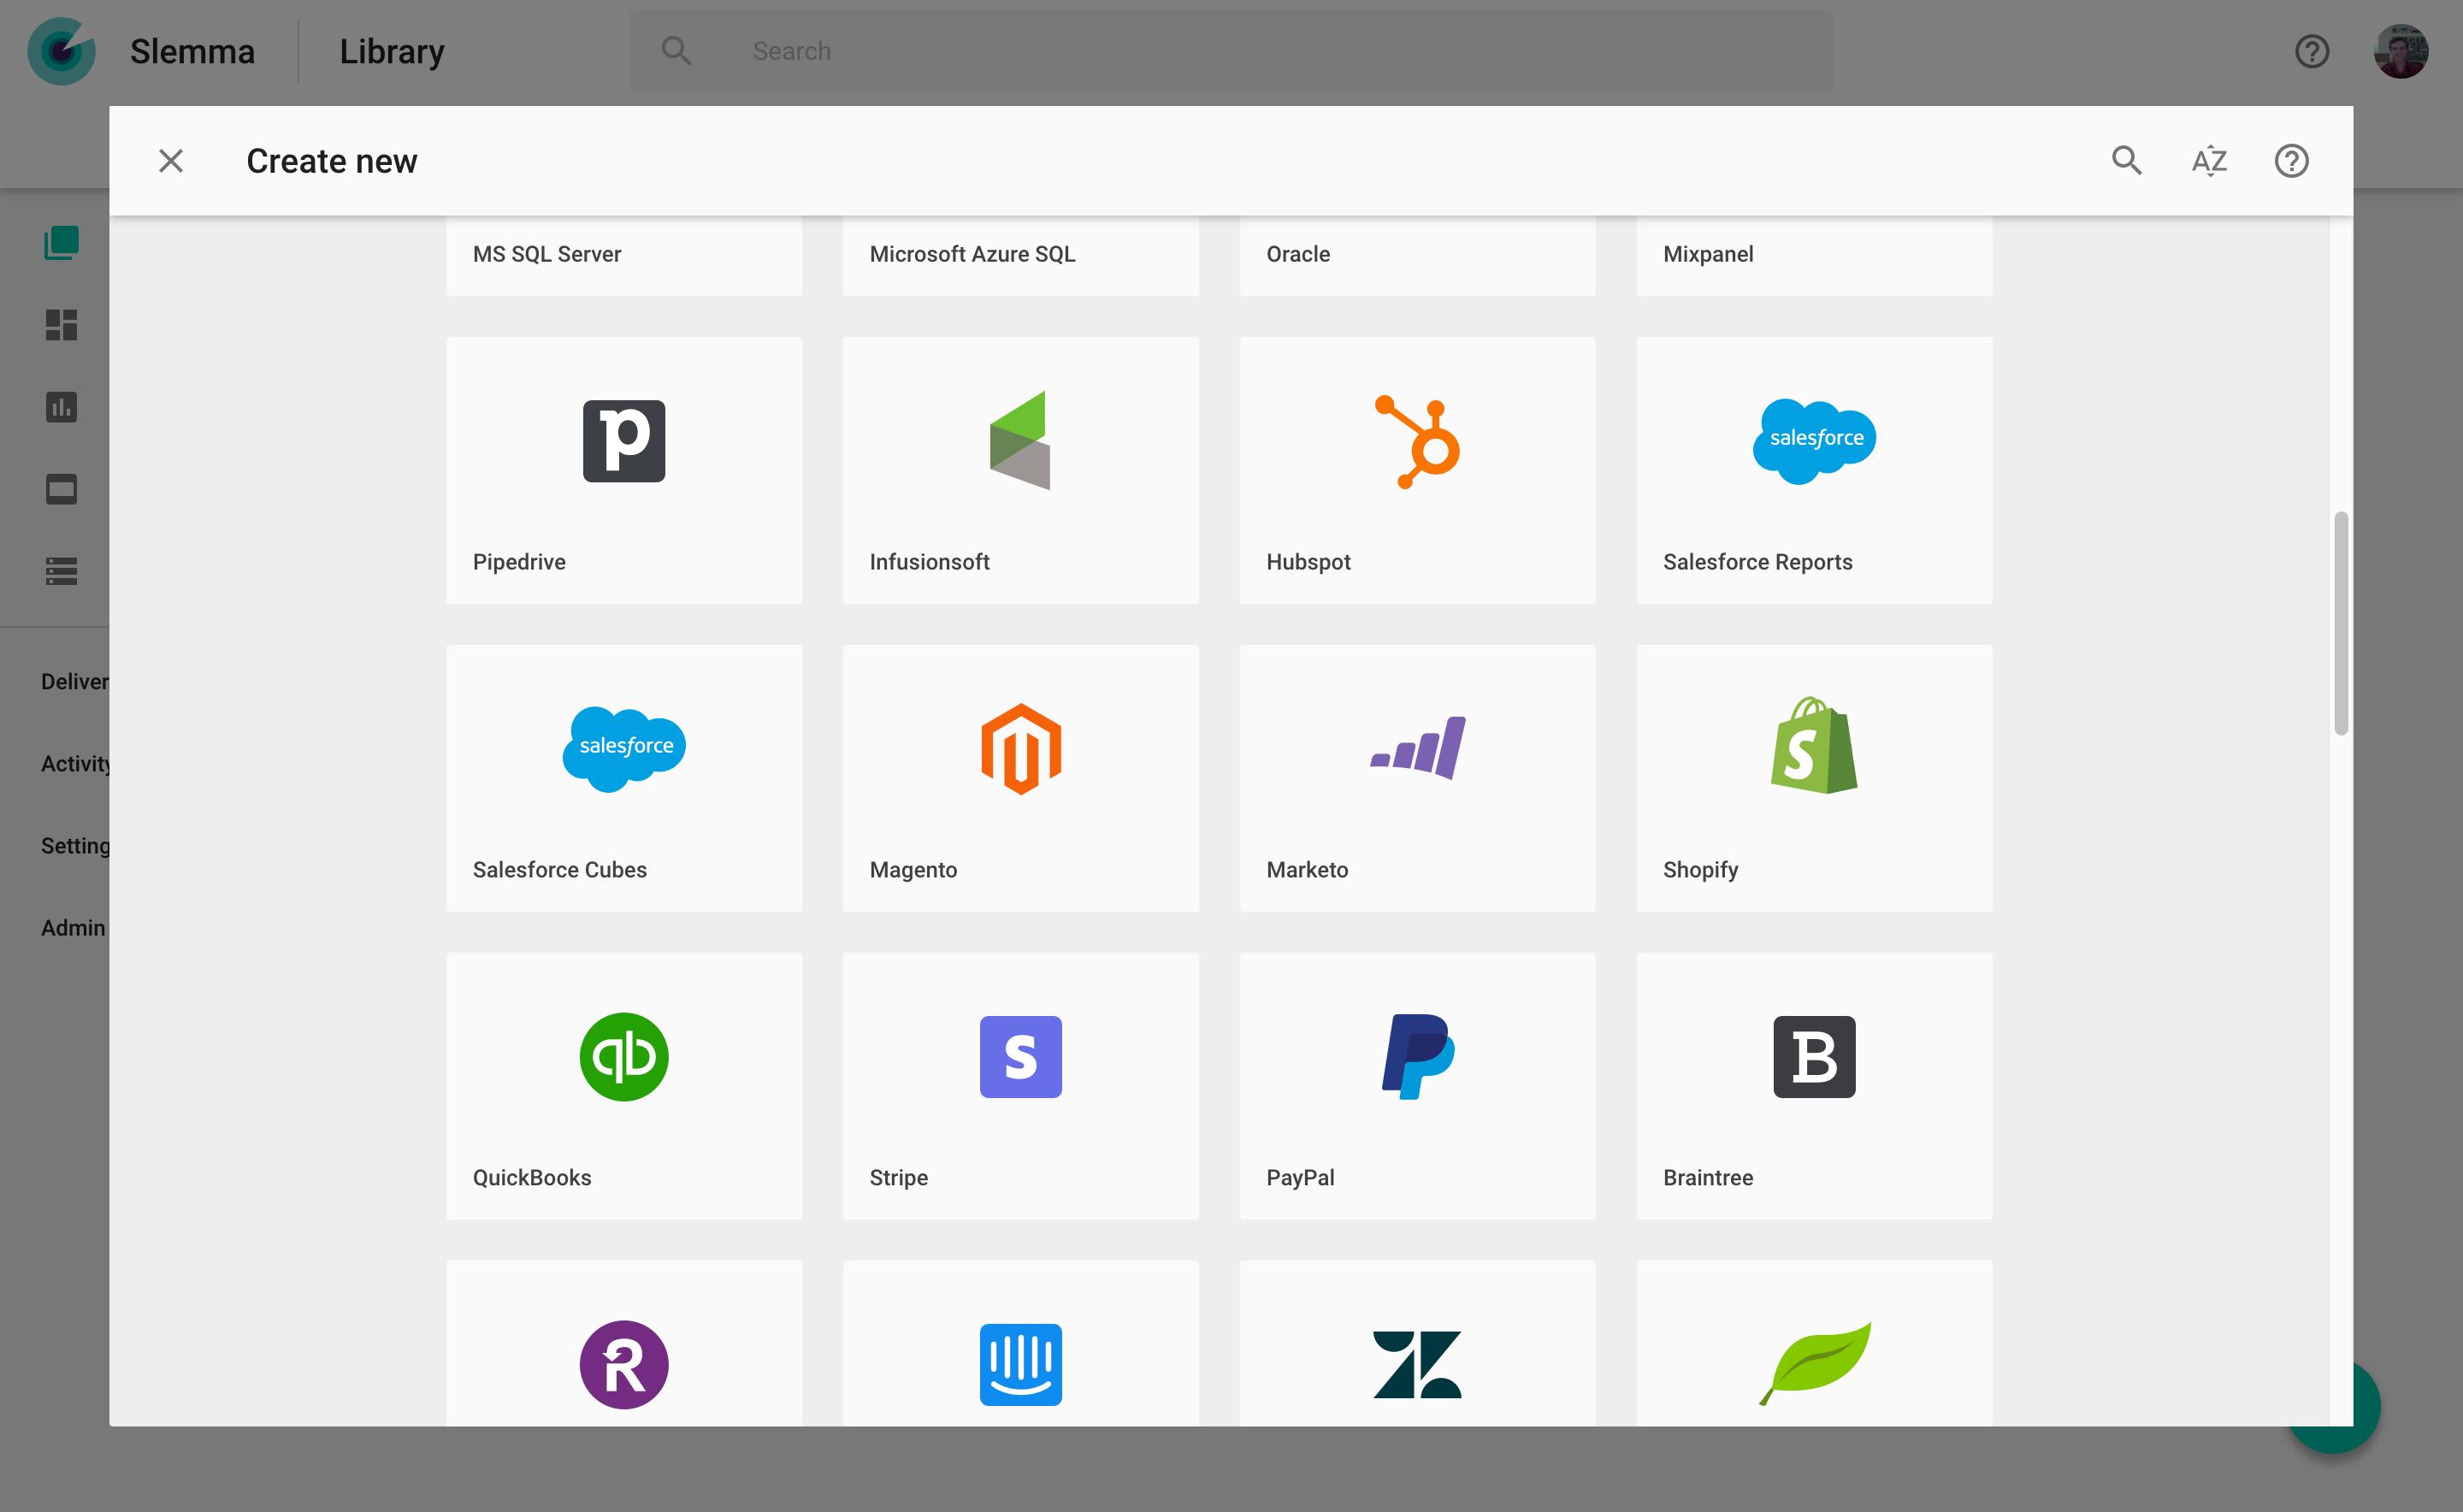
Slemma connects to 50+ data sources out-of-the-box: Google Analytics, Google Ads, Facebook Ads, LinkedIn Ads, HubSpot, Salesforce, Mailchimp, Constant Contact, Stripe, PayPal, Shopify, WooCommerce, BigCommerce, MySQL, PostgreSQL, Microsoft SQL Server, Amazon Redshift, Google BigQuery, Snowflake, Excel files, CSV files, and Google Sheets.
For agencies running multi-client reporting, the cloud service connectors (GA, Facebook Ads, HubSpot) are essential because they handle the data normalization that would otherwise require manual ETL work. For SMB internal analytics, the direct database connections (MySQL, PostgreSQL) let internal IT teams expose business data without building a separate warehouse layer.
Client reporting workflow
Client Reporting tier features include white-label client portals (agency-branded URL and look), per-client dashboards with isolated data, scheduled email delivery of dashboard PDFs to clients, and multi-tenant user management. An agency can manage 50+ clients from a single Slemma account, with each client seeing only their own data.
For agencies whose current monthly reporting takes 3-5 hours per client to produce, Client Reporting collapses that to 30-60 minutes per client (initial setup, ongoing tweaks). Across 20 clients, the time savings compound substantially.
Embedded analytics
Slemma dashboards can be embedded in third-party applications using iframe embeds or the API. SaaS companies use this to deliver in-app analytics to their customers without building dashboards from scratch in their own product. White-label options remove Slemma branding for the embedded experience.
For SaaS companies needing customer-facing analytics at lower cost than embedding Tableau or building from scratch, Slemma's embedded approach is competitive. The trade-off is less customization than building native; for many SaaS products this trade-off is acceptable.
Custom calculated fields and filters
Calculated fields apply formulas across data: customer lifetime value, conversion rate, cost per acquisition, revenue per click, ad ROAS. The formula syntax is approachable for non-technical users (similar to Excel formulas) rather than requiring SQL.
Filter controls let dashboard viewers slice data by dimension: by date range, by campaign, by region, by customer segment. Filters apply across all charts on a dashboard, so changing the date range updates the full view simultaneously.
Mobile and offline
Dashboards are mobile-responsive and work in any modern browser on phone, tablet, or desktop. There is no dedicated mobile app. For most use cases (executives reviewing weekly dashboards on phones, agency clients checking monthly progress on tablets) the responsive web experience is sufficient.
Security and compliance
Slemma is hosted on cloud infrastructure with encryption at rest and in transit. User permissions and role-based access control which dashboards and data sources each user can see. The compliance posture is adequate for SMB and agency use cases; enterprise buyers with strict SOC 2 or HIPAA requirements should verify the specific certifications against their requirements before committing.
Slemma vs Tableau
Tableau is the enterprise BI category leader with deep customization, broad community, and per-user pricing. Slemma is the SMB and agency alternative with simpler workflow and tier-based pricing. Pick Tableau for enterprise BI with dedicated analysts. Pick Slemma for SMB and agency client reporting without dedicated BI team.
Slemma vs Power BI
Power BI is the Microsoft-ecosystem BI tool with deep integration with Microsoft 365 and Azure. Slemma is platform-neutral with stronger agency-specific features. Pick Power BI for Microsoft-shop internal BI. Pick Slemma for agency client reporting or non-Microsoft-shop SMB.
Slemma vs Looker Studio
Looker Studio (formerly Google Data Studio) is Google's free BI tool with strong Google data source integration. Slemma is paid but offers a more agency-focused workflow (multi-client, white-label, scheduled reports). Pick Looker Studio for free Google-data-centric reporting. Pick Slemma when agency reporting workflow features justify paid subscription.
Slemma vs AgencyAnalytics
AgencyAnalytics is the direct competitor for agency client reporting with similar positioning and price point. AgencyAnalytics has stronger SEO-specific features and broader marketing tool integration directory. Slemma has more flexible dashboard building. Pick AgencyAnalytics for SEO-heavy agency reporting. Pick Slemma for broader BI workflow within agency operations.
Slemma vs ReportGarden and DashThis
ReportGarden and DashThis are alternative agency client reporting tools competing in similar mid-market. All three target marketing agencies. Differentiation comes down to specific data source integrations, white-label depth, and pricing tier alignment. Agencies should evaluate all three on the actual data sources they pull from most.
Buyer pitfalls to avoid
Three patterns hurt Slemma rollouts. First, picking Small Business when client reporting is the need: Small Business does not include the white-label and multi-tenant features agencies require. Pick Client Reporting upfront for agency use cases.
Second, treating it as enterprise BI: Slemma is intentionally simpler than Tableau or Power BI. Enterprise data engineering teams will find it limiting for complex modeling. Match tool to scale.
Third, ignoring data source quality: dashboards are only as good as the underlying data. Agencies that connect cluttered Google Analytics or unstructured CRM data produce dashboards that look polished but report nonsense. Invest in data quality before dashboard polish.
Implementation and time to value
Small Business: 1-2 weeks for data source connection, initial dashboard build, and team training. Standard: 2-3 weeks adding advanced charts and user permissions. Client Reporting: 4-6 weeks for white-label setup, multi-client onboarding, and report scheduling configuration. Slemma offers chat and email support during onboarding.
Customer support
Standard support includes email and chat during business hours. Higher tiers add priority response. The Slemma Help Center covers common dashboard-building scenarios, with template galleries for common use cases. Documentation is in English.
The Bottom Line on Slemma
Slemma is the right call for marketing agencies running monthly client reporting and for SMB businesses needing data dashboards without buying enterprise BI tools or hiring dedicated BI analysts.
Standout strengths: step-by-step Chart Designer for non-technical users, 50+ data source integrations including all major marketing tools, white-label client reporting on the agency tier, embedded analytics for SaaS products, calculated fields with Excel-like formulas rather than SQL, tier-based pricing rather than per-user.
Pricing fits SMB and agency budgets: Small Business $99/month (10 users), Standard $199/month, Client Reporting $599/month. The Client Reporting tier pays for itself within the first month for agencies serving 10+ clients with monthly reports. Tier-based pricing avoids per-user escalation as the team grows.
Trade-offs to weigh: less customization depth than Tableau or Power BI for complex enterprise dashboards. Some compliance certifications (SOC 2, HIPAA) are not prominently published, requiring verification for regulated industry use. Mobile is responsive web only with no dedicated apps. Brand presence in agency reporting is competitive with AgencyAnalytics and DashThis but smaller than enterprise BI tools.
Alternatives worth comparing: Tableau and Power BI for enterprise BI, Looker Studio for free Google-data reporting, AgencyAnalytics for SEO-heavy agency reporting, DashThis and ReportGarden for similar agency client reporting positioning, Whatagraph for marketing-tool-integration depth, Klipfolio for SMB dashboards. Pricing data from G2, Capterra, and SelectHub 2026 sources, capabilities verified on slemma.com on 2026-06-27.
Frequently Asked Questions
Is there a free plan or free trial for Slemma?
How much does Slemma cost?
What does Slemma integrate with?
Who is Slemma best for?
What are the best alternatives to Slemma?
Is Slemma GDPR / SOC 2 compliant?
Does Slemma have a mobile app?
What do real users say about Slemma?
How does Slemma compare to its top competitor?
Does Slemma offer customer support?
Find Your Perfect Software
See how it can transform your workflow
- Personalized for your needs Tailored recommendations based on your unique requirements.
- Save time & resources Streamline your workflow and boost team productivity.
- Trusted by thousands Join 10,000+ businesses already growing with SaaSrat.
You're all set! 🎉
A specialist for will reach out within 1 business day with tailored recommendations for your needs.